
Summary
Mike has completed two data based internships at Medtronic; analyzing and presenting survey responses, reporting on enterprise licenses, and reporting on site engagement. He has also completed coursework obtaining various skills related to working with data including familiarity with R programming and has completed various projects including some focused on climate action histories, job applicant employability, and news coverage.
Experiences
Business Analyst Internship, Medtronic
Planned and conducted interviews, and analyzed and presented on interview responses. Collected, analyzed, and presented on various Qualtrics survey responses. Managed enterprise licenses and analyzed and presented on the metrics of their use.
Marketing Analyst Internship, Medtronic
Tracked, analyzed, and reported on site engagement of more than 30 webpages by over ten-thousand users using Adobe Analytics, Tableau, and Microsoft Excel
CourseworkContent Analysis Methods
Used media coverage from national cable news station to analyze stylistic and production elements in the communication, and development of narrative, of news programming on specific events and series of events.
Focus Group Methods and Analyses
Learned methods of conducting focus group research and maintaining records of research. Utilized video and audio recording tools to record focus groups and utilized digital transcription tools to have textual records of the focus groups.
Hacking the Humanities
Developed skills in video production, web development, computer-aided design (CAD), and was introduced to and completed projects utilizing geographic information systems.
Introduction to Statistics
Introduced to introductory statistical concepts and R programming for statistical analysis. Gained the skills necessary to complete rudimentary hypothesis tests and analyses of variance (ANOVA).
Methods of Political Science Research
Introduced to intermediate levels of R programming and statistical methods to complete bivariate and multivariate ordinary least squared regressions of large data sets. Learned proper coding, cleaning, and storage of large data sets as well.
Social Justice Collections and Liberal Arts Curricula
Utilized collegiate archives and records to complete team developed research plans and design. Used a timeline development tool and text analysis tools to complete the analysis and presentation of the project.
Projects
Comparative Climate Action Histories on College Campuses:
A project that examines college campus planning and responses to climate change. Utilize climate action plans, newspaper articles, and updates to the colleges’ infrastructure to demonstrate, compare, and contrast the process of climate change mitigation and sustainability on a college campus over time. Analysis was done through Voyant Tools and a timeline developed using TimelineJS through Knightlab.
Job Applicant Employability and Perceived Race:
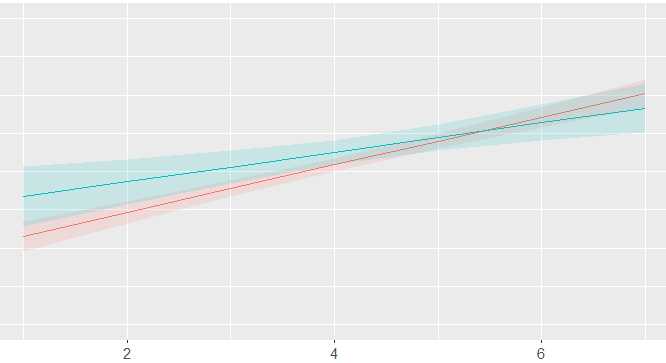
A paper exploring the relationship between perceptively black names and applicant employability compared to perceptively white names, during the job application process. R was used for computational data analysis and visualization.
An analysis of the coverage of Fox News, CNN, and MSNBC national cable news station on the murder of George Floyd and the subsequent protests. Data analysis was completed using Microsoft Excel.
Parental Cohabitation Status and Student Alcohol Consumption:
A paper exploring the association between parental cohabitation status and student alcohol consumption using R for computational data analysis and visualization.
Place Based Identity and Political Party and Policy Preferences:
COMPS – in progress, will be updated when completed.
